What a Two Percent Difficulty Move Does to One Rig
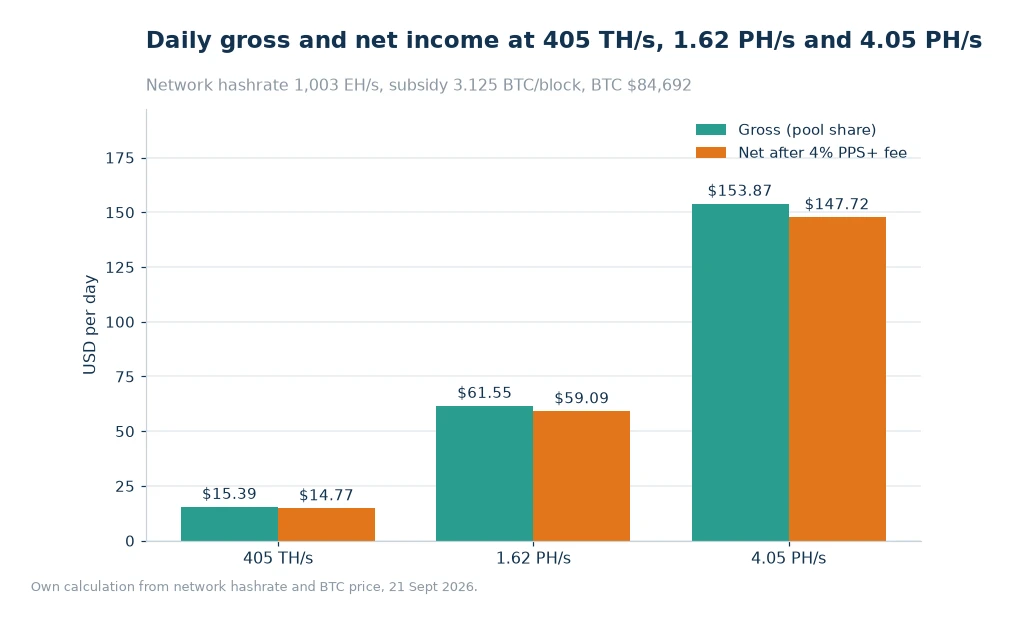
A 405 TH/s machine produces 0.00018169 BTC a day at the network values read on 21 Sept 2026, worth $15.39 gross and $14.77 net. If the next adjustment lands at the projected −2.12%, the same machine produces 0.00018564 BTC, about $15.09 net. A two percent move in difficulty is a two percent move in income, and that symmetry is worth understanding before it happens.

Key takeaways
- 405 TH/s yields 0.00018169 BTC a day, or $14.77 net after the listed block-reward charge.
- A −2.12% adjustment lifts that to 0.00018564 BTC and $15.09 net; a +2.12% move cuts it to $14.46.
- The swing is $0.63 a day between the two outcomes, or about $19 across a month.
- Model the range before buying, because the direction of the next print is not known in advance.
The estimate that arrives with the difficulty print
Difficulty is published as a single number, but the interesting part is the estimate attached to the next adjustment. A projected −2.12% means the network expects to find blocks slightly more easily, which raises the share each terahash receives. A positive number means the opposite. Neither figure is a promise; both are useful for stress-testing a plan.
For a miner, the practical translation is a percentage applied to daily output in the opposite direction. Difficulty down by a little over two percent means output up by roughly the same proportion. That is close enough for planning at this scale, and it avoids a detour into the precise relationship between difficulty and expected time per block.
Direction matters more than the headline
Two miners read the same print and reach different conclusions because one is planning a purchase and the other is planning a sale. A buyer wants to know what happens if difficulty rises after delivery. A seller wants to know whether the current income is about to improve. The number is identical; the question is not.
This is where a tool that lets you enter a difficulty is more useful than a single quoted rate. The ViaBTC Mining Calculator accepts the network inputs you give it, so you can run the same rig three times and see the spread for yourself. The spread, not the midpoint, is the thing to carry into a decision.
Running the same rig at three network sizes
The table holds the hardware fixed at 405 TH/s and moves only the network. The last column is the change in net income against the base case, which is the figure that matters to a household or a small operator.
| Network | Hashrate | BTC per day | Gross USD | Net USD | Change |
|---|---|---|---|---|---|
| 2.12% easier | 981.7 EH/s | 0.00018564 | $15.72 | $15.09 | +$0.32 |
| Base | 1,003 EH/s | 0.00018169 | $15.39 | $14.77 | — |
| 2.12% harder | 1,024.3 EH/s | 0.00017793 | $15.07 | $14.46 | −$0.31 |
Three rows, one machine, a range of $0.63 a day in net income. Put that next to a power bill that varies by more than $0.63 across a month and the difficulty print starts to look less frightening than it is often made to sound.
Where the sensitivity stops being small
Two percent is noise on a single print. It stops being noise when it compounds. Four adjustments of the same direction in a year move annual output by roughly eight percent before any change in price, and a bad year can stack several such prints. That is why annual projections built on today's difficulty deserve a wide margin.
The other place it stops being small is at the margin of profitability. A machine whose net is thin at the base case can be pushed into negative territory by a single upward adjustment, particularly if power is expensive. The percentage is the same; the consequence is not, because the buffer underneath it differs.
Rent and power do not fall when difficulty rises. That is the asymmetry a percentage table hides: income moves with the network, costs do not. An operator with a cheap fixed power contract can absorb several upward prints; one paying a variable rate has less room, even with identical hardware.
Worked example
Building the three rows from the same inputs, so the spread can be checked rather than trusted:
- Daily issuance: 144 × 3.125 = 450 BTC.
- Share per TH/s at the base network: 450 ÷ 1,003,000,000 = 0.00000044865 BTC.
- Rig at 405 TH/s: 405 × 0.00000044865 = 0.00018170 BTC, recorded as 0.00018169.
- Gross: 0.00018169 × 84,692 = $15.39. Net at the listed 4%: 15.39 × 0.96 = $14.77.
- Easier network, 981.7 EH/s: 450 ÷ 981,700,000 = 0.00000045837 BTC per TH/s; × 405 = 0.00018564 BTC, or $15.72 gross and $15.09 net.
- Harder network, 1,024.3 EH/s: 450 ÷ 1,024,300,000 = 0.00000043934 BTC per TH/s; × 405 = 0.00017793 BTC, or $15.07 gross and $14.46 net.
- Spread between the outer rows: 15.09 − 14.46 = $0.63 a day, or $18.90 over 30 days.
Planning with a range instead of a point
Write three numbers on the plan: the base case, the case where difficulty rises two percent, and the case where it falls by the same amount. Then ask whether the plan survives the worst of the three. If it does, the exact next print hardly matters. If it does not, the plan is relying on a favourable adjustment, which is not a plan. Three lines on one page beat a single confident number every time.
The same range belongs in any conversation with a lender or a partner, because a single projected figure invites an argument about precision that the underlying data cannot support. A band invites a discussion about buffer, which is the useful conversation.
The Profit Calculator is quickest for building those three rows: enter the hashrate once, change the difficulty, and note the dollar result. Save the three outputs with the date, and the next time an adjustment print arrives you will have a comparison rather than a guess.
The other variable in the same equation
Price moves more than difficulty and moves faster. A two percent difficulty change is small beside a ten percent day in the coin, and the two effects can point in opposite directions. Keeping them separate in a model prevents the common mistake of attributing a price move to the pool or a difficulty move to the hardware.
Check the network side on the pool statistics page and the price side wherever you trust it. The two columns should never be multiplied into one number until the end, or the explanation of a change disappears into a single total. Keep them apart in the notes and the story stays legible.
Frequently asked questions
Is a lower difficulty always good news?
For income at a fixed hashrate, yes, because the same machine captures a larger share; it often reflects a price fall that matters more to the dollar value.
How often does difficulty change?
On Bitcoin it retargets roughly every two weeks, so a 30-day window usually contains two adjustments and a year contains about 26.
Should I buy based on the projected adjustment?
No. Use the projection to test the range, and treat the base case as the number the purchase has to justify on its own.
Keep the estimate in proportion
A projected adjustment is a weather report, not a climate. It tells you what the next fortnight might do and nothing about the year. Plan with the band, keep the base case honest, and let the wallet accumulate what actually arrives rather than what the projection suggested.
When the print lands, compare it with the band you wrote. Over a few cycles you will know how wide your own error bars need to be, which is more valuable than any single forecast.
Sources: the ViaBTC calculator and statistics pages for hashrate and difficulty inputs[1]. Readings taken 21 Sept 2026: network at 1,003 EH/s, difficulty 132.76 T, subsidy 3.125 BTC, 144 blocks a day, BTC $84,692, projected adjustment −2.12%. Published 24 Oct 2026; scenario rows apply that percentage symmetrically for illustration.